Arcy Douglass
arcydouglass at gmail.com
I have recently completed the Full Stack Javascript and the Front End Freelancing classes at the Portland Code School. My projects concentrated on development on both the front end and back end. Some of the frameworks and libraries that I have been working with include: Node, Bootstrap, Handlebars, Orchestrate and D3. I have also been using and customizing major Content Management Systems (CMS) like WordPress and MODx. All of my projects are also version controlled on Git and we rely on Basecamp for Project Management.
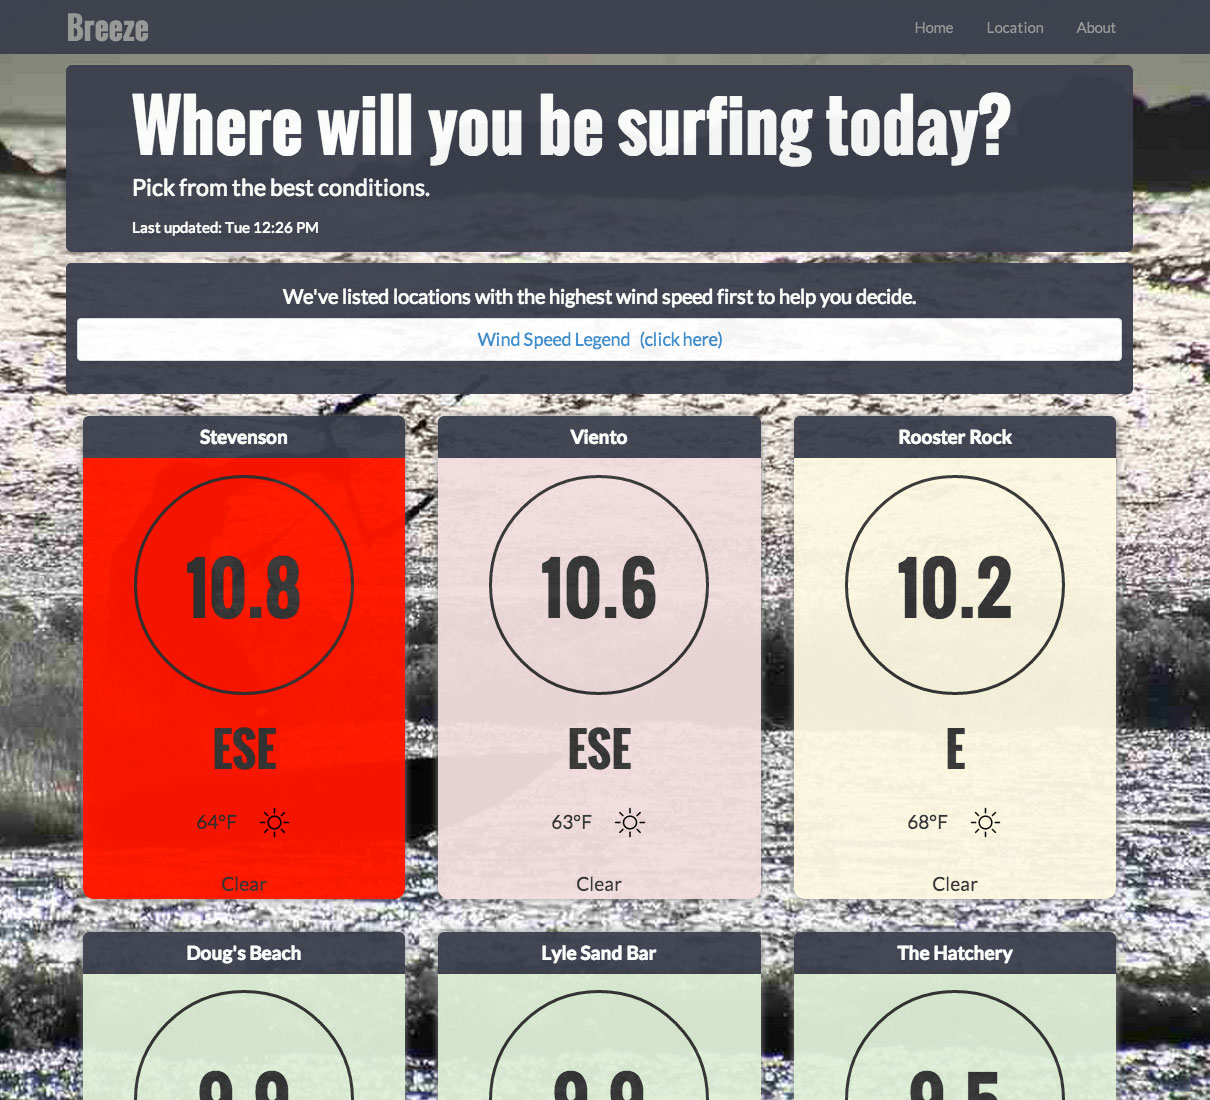
Breeze
For our final project in the Full Stack Javascript Class, I was part of a team that developed a web app that we called Breeze. Breeze provides current wind conditions for ten of the best kite surfing locations in the Columbia River Gorge. We access data from the third party API Forecast.io with our server, load the data into Orchestrate and display the data to the client's browser by integrating Backbone and D3. All of the site navigation is handled locally with Backbone routes. The 48 hour wind forecast chart was rendered in D3.
Click To Learn More Github Link Project Overview on Trello Link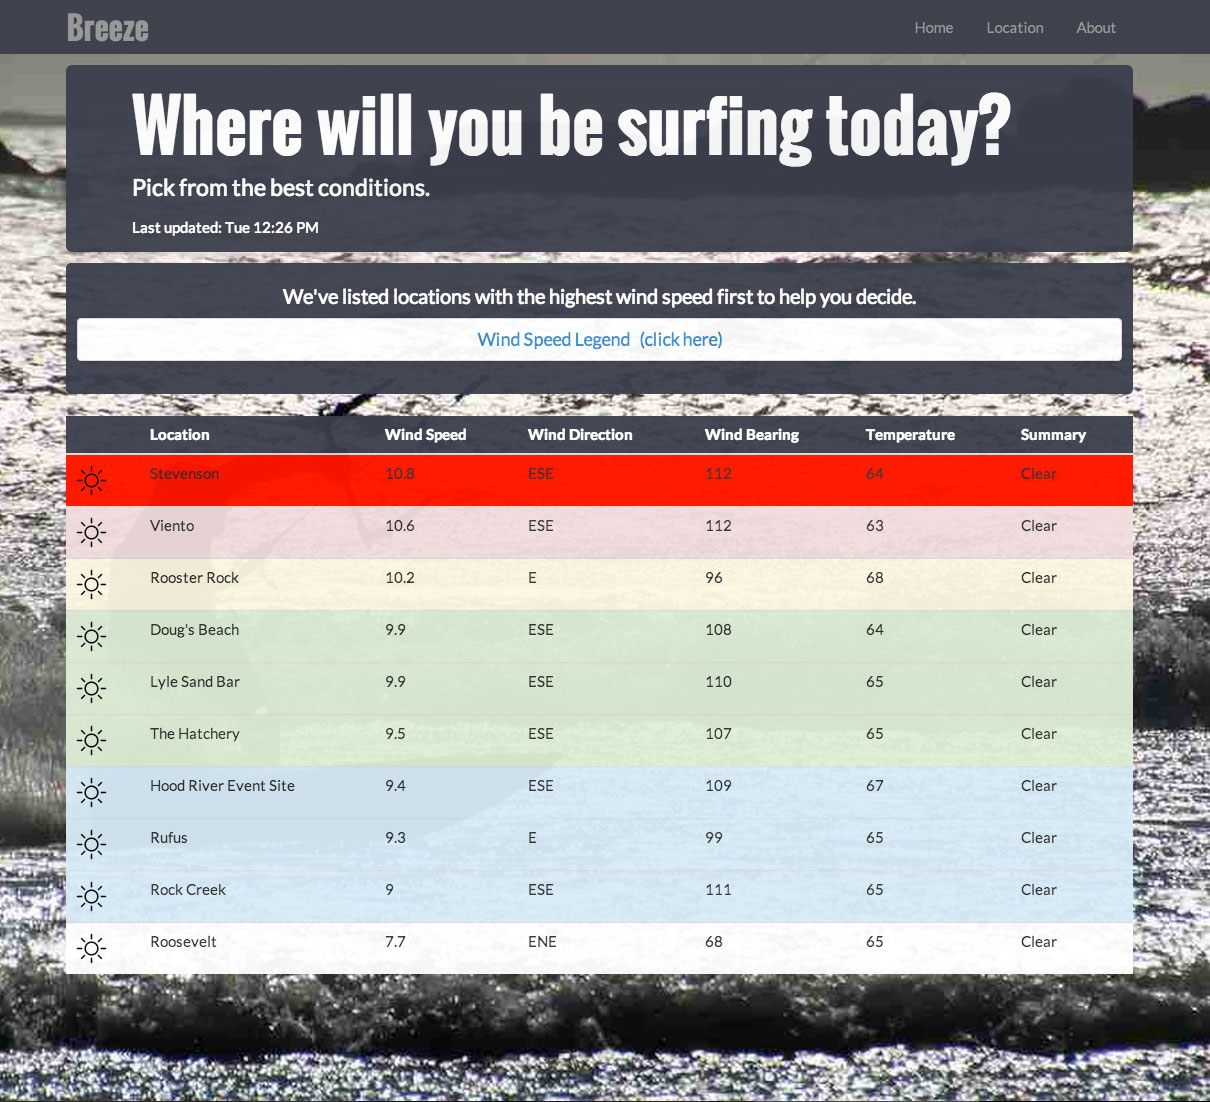
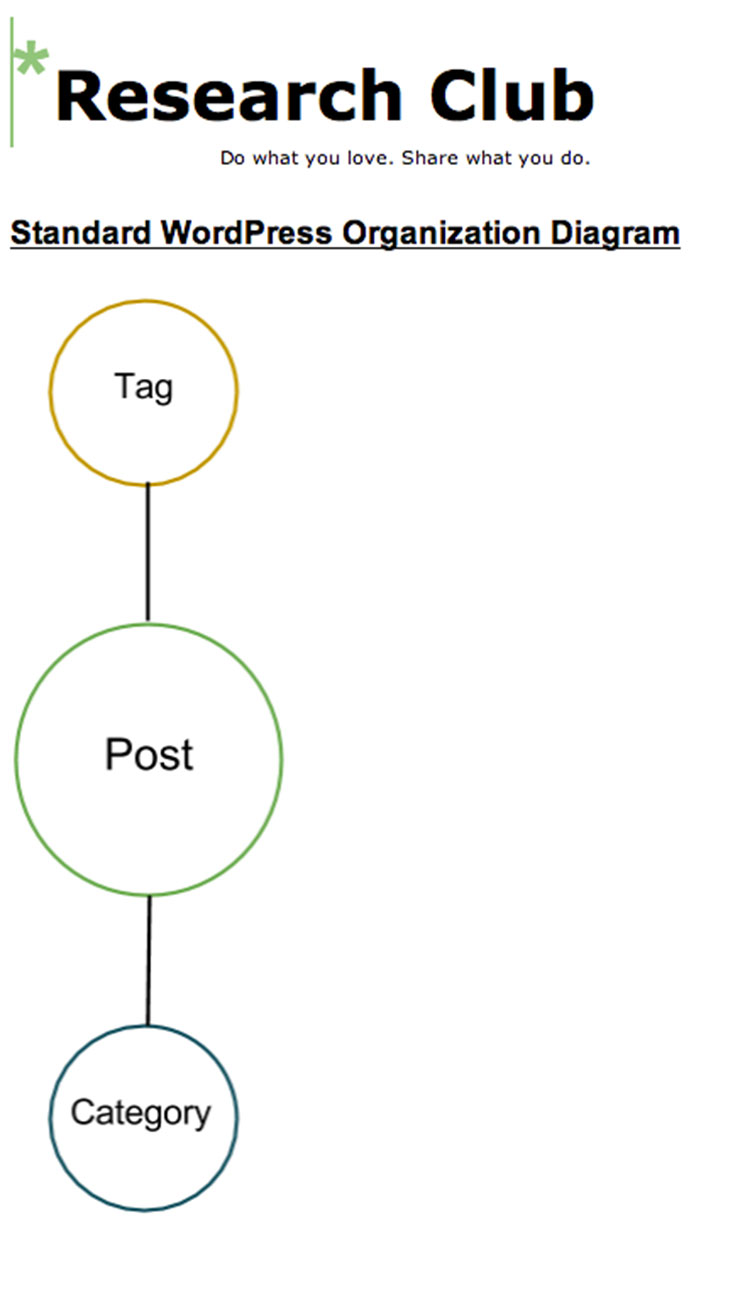
Research Club
The goal of this project was to develop a way for Research Club to present the information generated from a series of talks and find out the best to implement it in a WordPress plugin calledPods. Over the course of the project, I gained a much deeper of understanding of how to organizes posts and pages but also strategies to take advantage of templating within the WordPress hierarchy. I learned that I can use Pods to organize complex sets of information and how to use the templates to make sure that it displays correctly.
Click To Learn More Click for Project Development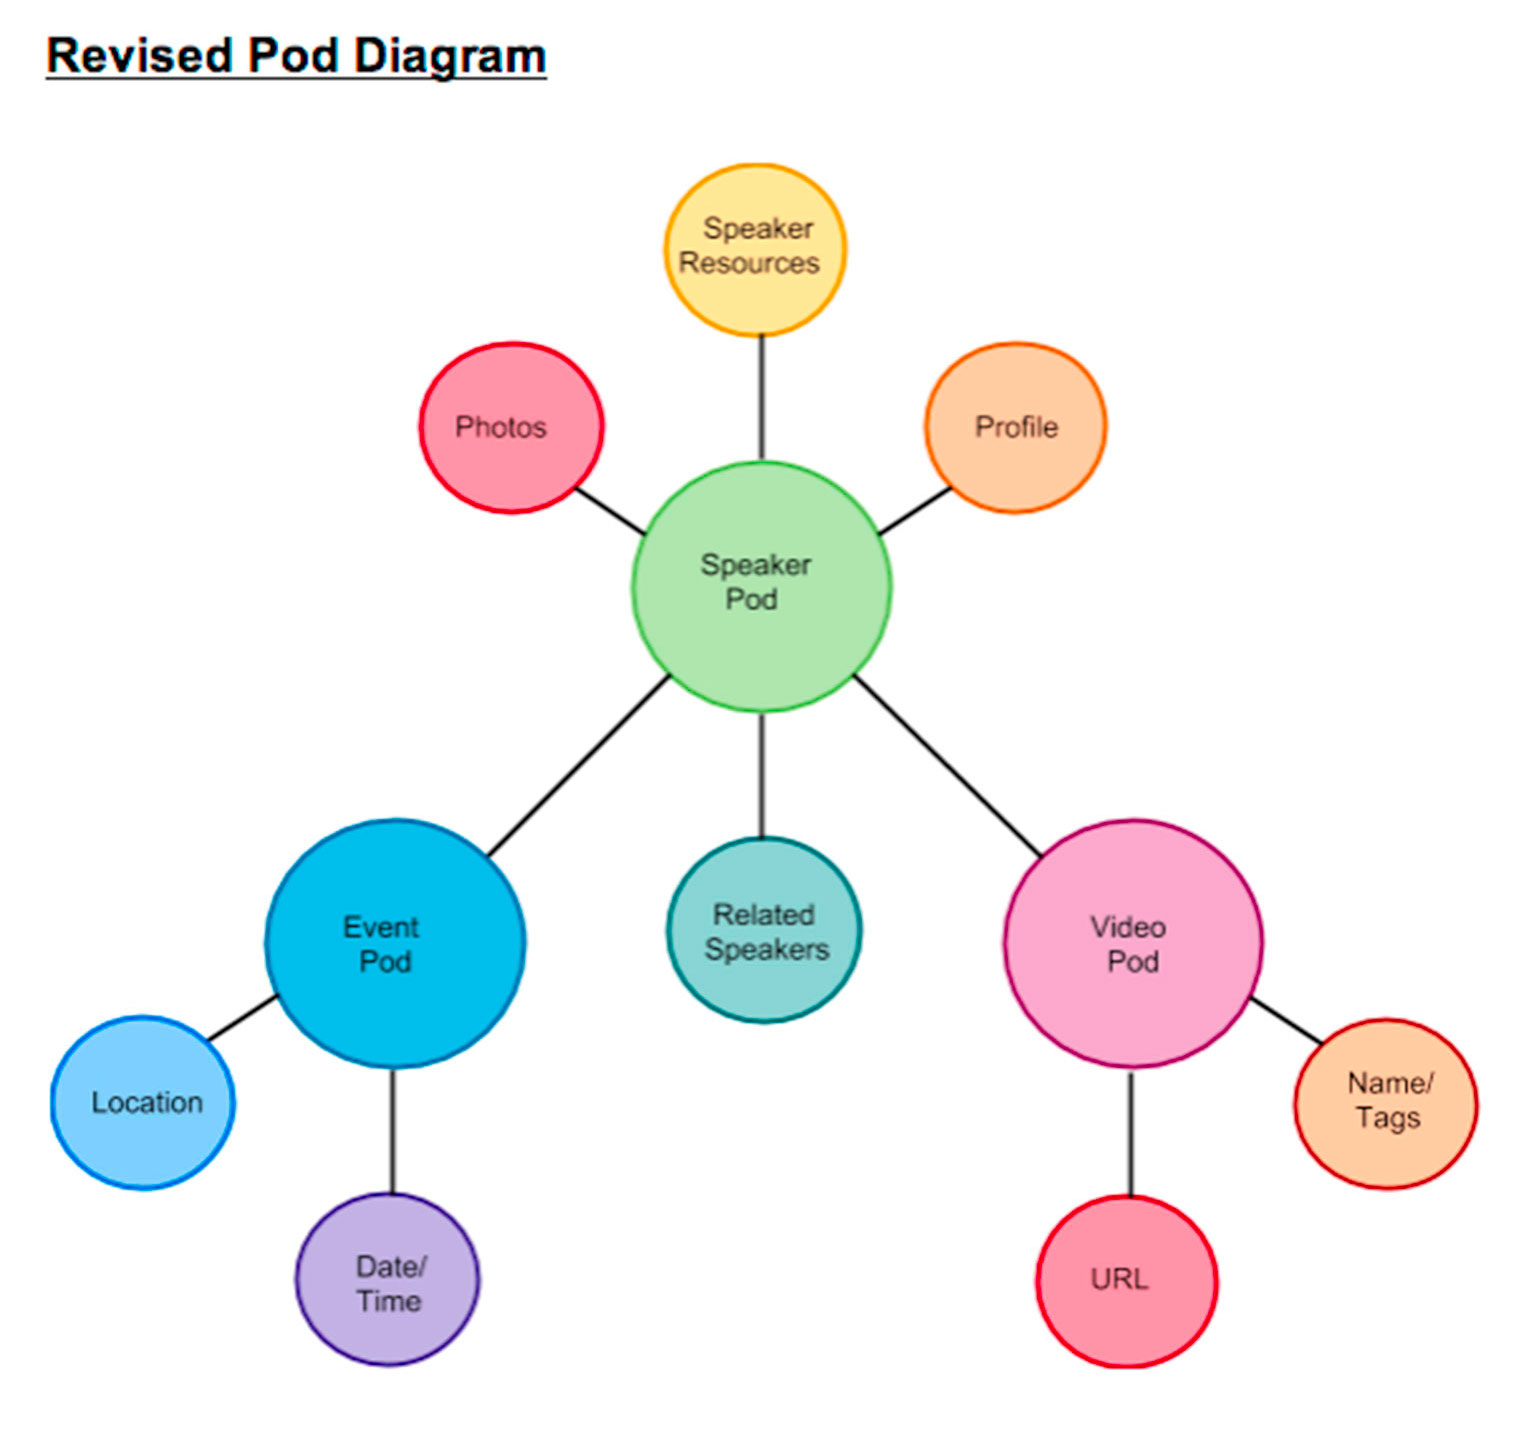
D3 Word Frequency Chart
An experiment in counting and charting the keywords of Milton's text Paradise Lost. The words are displayed in a donut using the the pie layout from the D3.
Github Link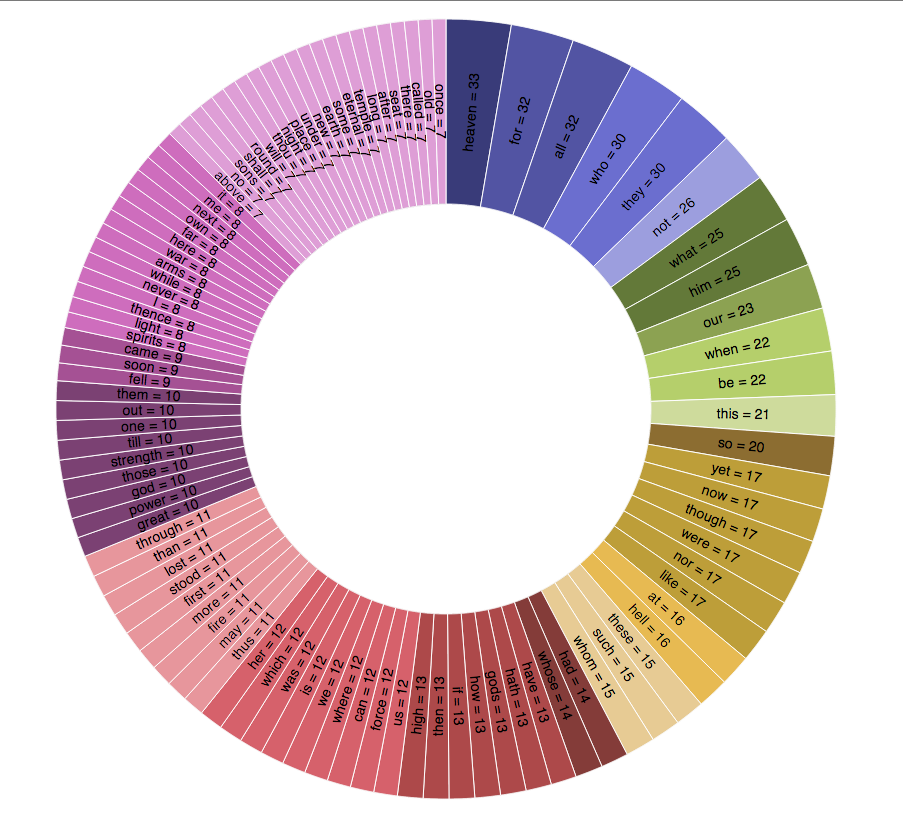
SVG Experiment
This project was an experiment to incorporate SVG elements into a web page. The arcs are generated according to an algorithm that assigns a location based on an external source like the digits of pi or a random number generator.
Github Link Learn More About Related Work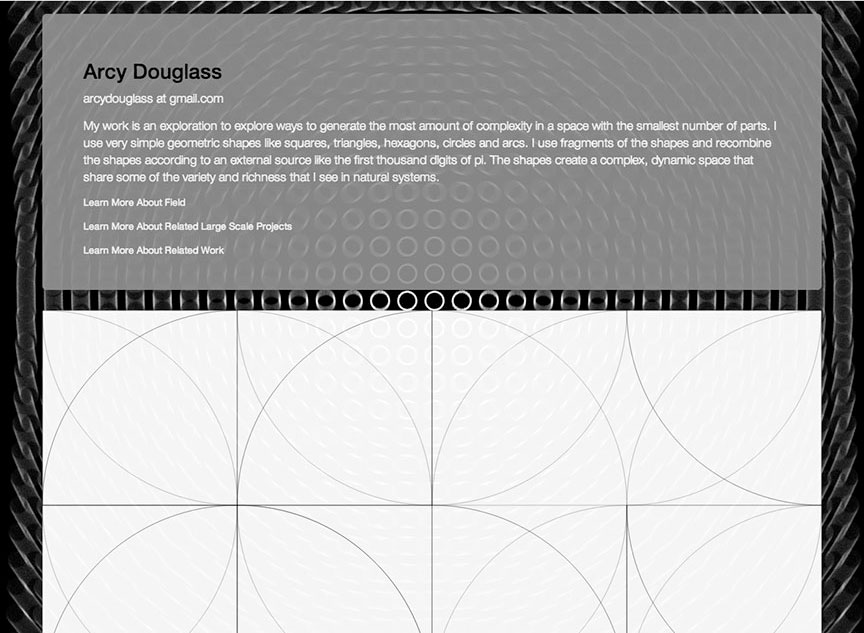


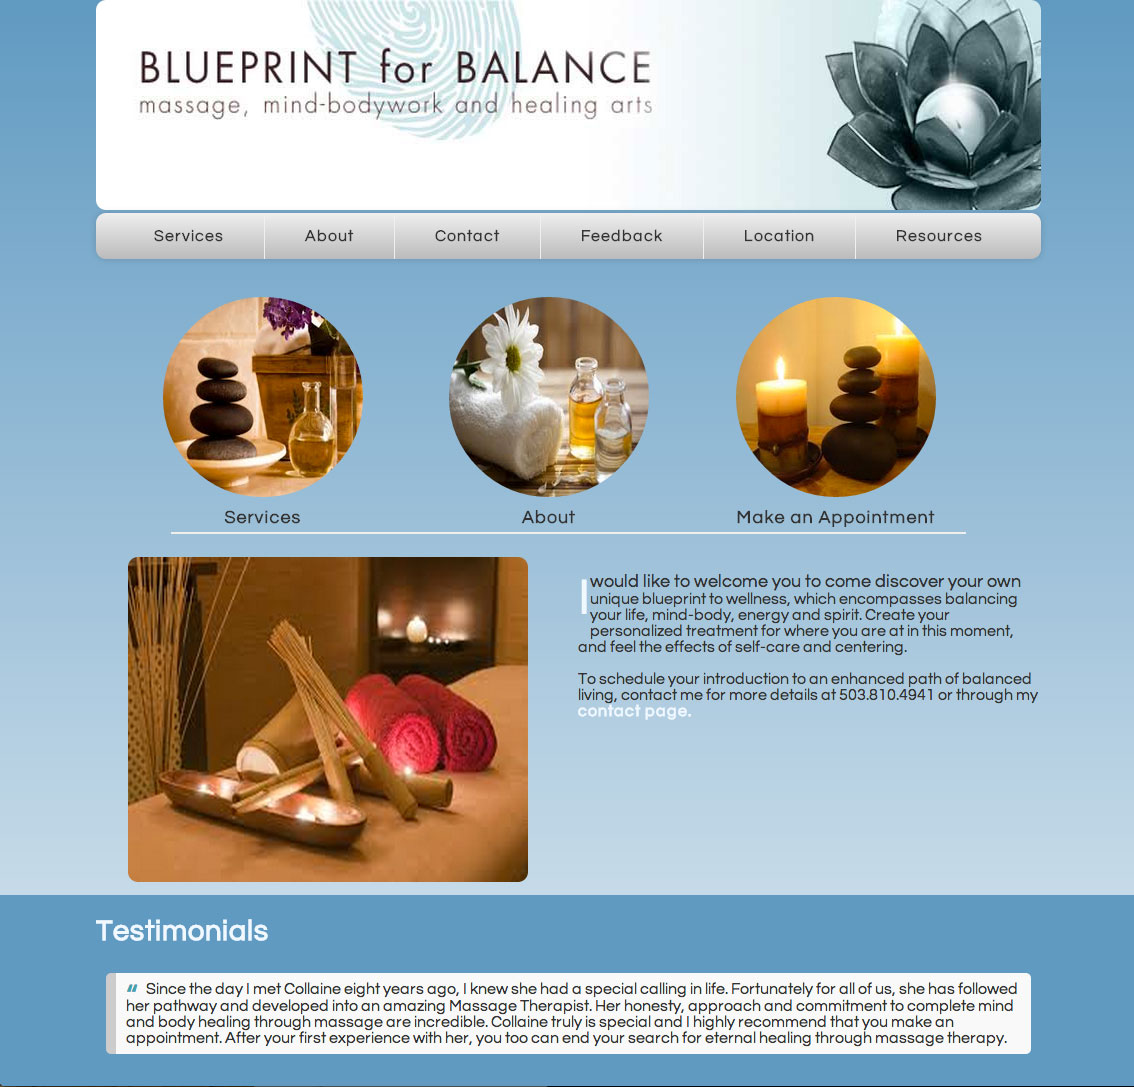
Blueprint for Balance
This project was an assignment for the Portland Code School Primer Class. The purpose of the project was for our team to learn the basics of HTML, CSS and Git.
Github Link